I’m expecting to be emailedl the link to my final exam in the Coursera statistics course this weekend, and by way of revision I’m using my own data in R for the first time.
The first challenge is making sure my data is R “fit” – I entered it into Excel the first time, and though I made sure that even category data was entered numerically, I did some foolish things. The first of which was entering the data for the recommendation rating in catagories rather than just putting the raw score in. So I’ve just gone back to my original collected data and re-inputted the raw numbers.
Then I needed to get the excel data into R. I like this post on that subject, which starts off with “don’t put it into excel in the first place.” It seems the quickest way is [Ctrl]+[C] copying the relevant data in Excel, then in R entering > gh <- read.table(“clipboard”) lets try that.
Warning message:
In read.table(“clipboard”) :
incomplete final line found by readTableHeader on ‘clipboard’
Oh dear, that doesn’t look good, what does the table look like in R?
V1 V2 V3
1 gh <- read.table(“clipboard”)
Hmmm no. So then I use the not-lazy method, exporting the Excel sheet into a tab delimited text file. Then reading the table (remembering this time to add the argument “header = T”). Well it seems to work, but the last column (my carefully inputed actual values for recommend) isn’t there. Why? I still don’t know, having tried again and again, adding extra blank buffer columns and reordering columns. All I get is:
Error in scan(file, what, nmax, sep, dec, quote, skip, nlines, na.strings, :
line 1 did not have 57 elements
So lets try a third method, exporting the excel sheet to the csv (comma separated values) file and using read.csv(“gh.csv”, header = T) rather than read.table.
Aha success! Though some (but not all) of the blank fields come up “NA” rather than empty. I’ll work out if I need to worry about that later.
Lesson one learned. “Don’t put it into excel in the first place.”
But now I have my data in R, I can at least have a look at it by using the describe() function (as long as I have loaded the package library(sm), which I have). The table that produces tells me that some of my category date is easily identifiable as such, the “Very enjoyable” five category Likert question is full of NAs (and NaNs – don’t know what that means). Same with the categories describing the groups that the respondents visited with, and the weather. That’s fine, I don’t need to worry about those yet. More importantly the continuous numerical data has returned a number of descriptive statistics.
I asked a number of questions scored on a seven point Likert scale, about how much respondents agreed with statements that: the experience added to their enjoyment of the visit, and added value to their visit; their choices changed the story; they felt an emotional impact; it was a great story; they learned about the history of site; they were inspired to learn more; and, they enjoyed listening as a group. I also asked them to score on a ten point scale how likely they were to recommend the experience to friends and family.
You could argue that being a Likert scale, this is categorical data, but I think there’s a strong case for arguing that it is continuous, especially if you collect the data with something like QuickTap survey. That’s not the case with other Likert scale questions, like the one I asked based on a National Trust survey question about how much they enjoyed their visit. Those five options are clearly categorical.
The describe function shows a number of summary statistics for all the data I collected. For each question I asked, I can see (among other things):
- the number of respondents;
- the mean;
- the standard deviation;
- the median;
- the range;
- the skew;
- the kurtosis; and,
- the standard error.
I got 39 responses for most questions, one person declined to answer the the question on story so I’ve only got 38 there. And only 34 answered the question on being a group (the other five came on their own).
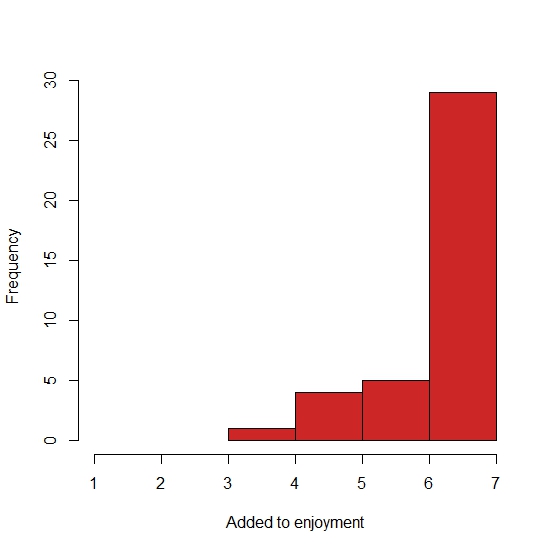
Looking at the means and medians, you can see that some questions (adding to enjoyment; adding value; and learning) were answered very positively – the median is the top score, 7, and the means range from 6.44 to 6.59 and nobody scores less than four. Make a histogram of these and you’ll see they are not “normal” curves. They are negatively skewed (“the skew is where there’s few”) and indeed, the describe function reports a skew of -1.72 for the “Added to my enjoyment” question.
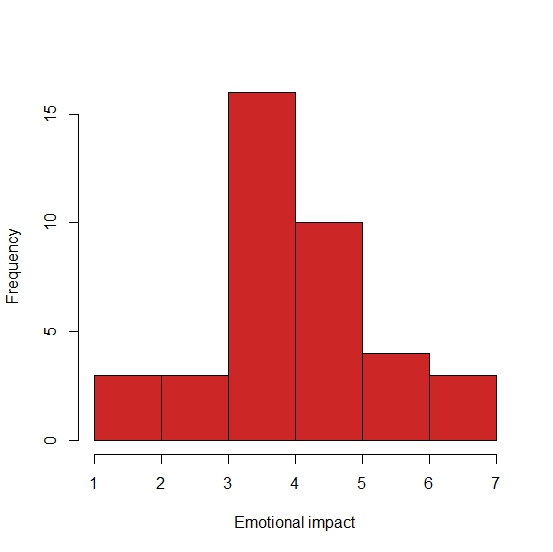
In contrast, the answers to the question on emotional impact are approaching something like “normal”:
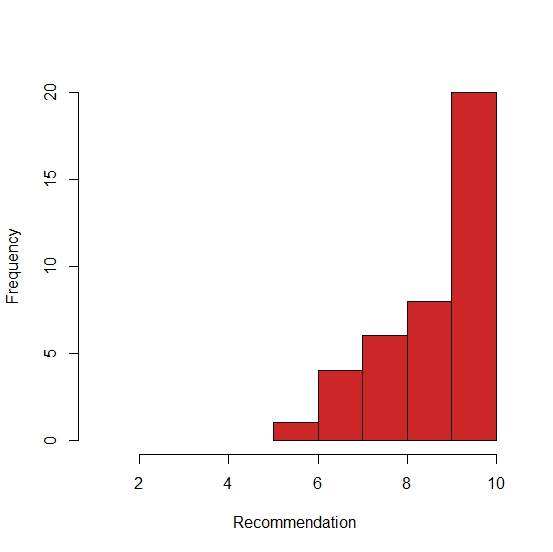
All of this might look a bit familiar, like the bar charts I got from Excel (with some wrestling to get them on WordPress) in this post. I’ll admit I’m somewhat covering old ground here, but bare with me while I get my head around this new way of working before moving on. I have to say the ease of saving these histograms into jpeg to upload onto WordPress makes me never want to see another Excel sheet again. Doubtless I will, however. Lets try an other histrogram, plotting responses to the 10 point Recommendation scale:
Cool. Again, not “normal” and so I know I shouldn’t be doing what I’m about to do, but I want to see if there’s any correlation between some of the responses to the 7-point Likert questions I asked, and Recommendation. So, lets try some regression!
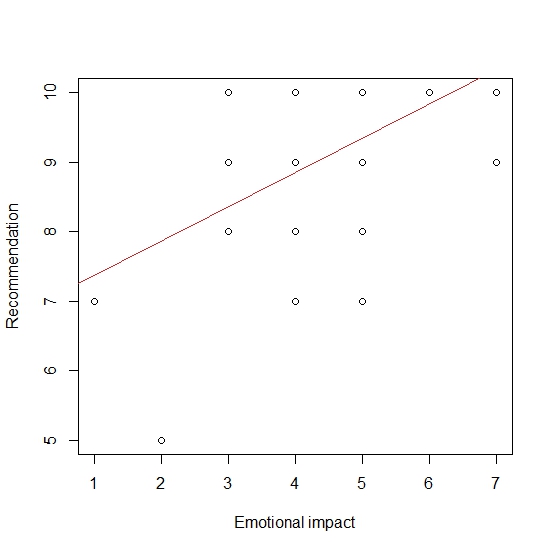
So, there is some correlation. (Remember correlation does not equal causation.) This regression model of recommendation and reported emotional impact tells us that the predicted intercept (Recommendation with zero emotional impact) is 6.88, and the regression coefficent is about 0.49. R squared (the proportion of variance in recommendation explained by emotion impact) is about 30%, which seems reasonably chunky.
Lets finish off with a Null Hypothesis Significance Test (NHST).
Pearson’s product-moment correlation tells us that t = 3.9748, degrees of freedom = 37, and the p-value = 0.000314. Its that p-value is less than 0.5 which the the arbitrary number that marks the divide between the null-hypothesis being true and false. It measures the probability of my obtaining these (or more extreme) data, given the assumption that there is no relationship between the variables. the As my p-value is less that 0.5, and can “reject the null”. Of course I might have made a Type 1 error here.
So what have I learned?
First of all, I’ve learned how long this takes. I’m only about a third of the way through what at learned on the course, and the email about my final exam is due tomorrow!
I’m also aware that I’ve “proved” a correlation between a variable with a “normal”(ish) distribution, and another with a very different distribution. My revision hasn’t got to what to do about non-normal distributions yet.
I’ve also learned that I need more data. When I’m making a scatterplot, more dots make me feel more confident in my findings. Though I’m reminded that NHSTs are biased by sample size, so that confidence can be false!
I also want more variance in my data. Likert scales on paper are limited, but in future I’m inclined to offer ten or eleven point scales where I can on paper, and as I discovered with the data I collected at Bodiam, touch-based sliders offer an opportunity to create 100 point scales which should discourage “clumpyness”.
And I’m still convinced I can be cleverer with the questions, to obtain more “normal” data distribution curves.
