Questions, questions

My head is full of questions today. On the one hand, I need to get some front end evaluation data on young people and mobile gaming together, in just a month, so I’m composing an online survey about that.

On the other hand it is the deadline for Bodiam Castle to submit bespoke questions for the National Trust’s visitor survey, so I need to get my head around what questions to try and persuade them to add. It can’t be everything that I’ll eventually ask on site, because the National Trust visitor survey is already pretty long. The most obvious one is did the visitor actually do (what I’m currently calling) “the thing” (because I don’t yet know what they’ve decided to call it)?

With my third hand (if only) I need to crack on the with composing the interview questions for my planned research into the relationships between tech companies and heritage organisations…

But I’m going to leave that and  Bodiam to one side for a moment and concentrate on the other survey. I need to ask about the target audience’s social media use, but before I do that, I ought to review what we already know. And I know very little. I hear from the papers that Facebook use is on the decline among young people because all us oldies are spoiling their fun. To which I want to say “It was always meant to be for us oldies anyhow, to keep in touch with our University friends as we got older and drifted apart. Your place, my young chums, was meant to be MySpace, but like a teenager’s bedroom you let it get messier and messier before you moved out.”

But actually my 12 year old is counting down the days to her birthday when she’ll be able to comply with Facebook’s terms and conditions and open an account (which all her friends with more relaxed parents have apparently already done). So it seems there’s life in the old network yet. My first point of call of course was to ask her what “the young people” were using nowadays, but she didn’t say anything that was new to me. And actually she’s a bit younger than my target market, so I had better turn to some published data.

The Pew Research Center tells me that 90% of all internet users aged 18-29 (which is pretty close to my target market) in the US (which is not) use Social Media. They also report proportions of the the 18-29 age band using particular social platforms. In 2013 they asked 267 internet users in that age band about what they used:

84% used Facebook

31% used Twitter

37% Instagram

27% Pintrest, and

15% LinkedIn.

I think its interesting that there’s such a steep difference between Facebook and the also-rans. The curve leaves very little room for other networks like Foursquare.

Meanwhile the Oxford Internet Surveys show us that use of social media is begging to plataux at around 61 % of internet users generally. They also show us that Social Network use gets less the older the respondent is, with 94% of 14-17 year olds using networks,  dropping t0 the mid-80% (the graph isn’t that clear) for 18-24 year olds.

The full report of their 2013 survey concentrate on defining five internet “cultures” among users.

Although they overlap in some respects these cultures define distinctive patterns. While these cultural patterns are not a simple surrogate for the demographic and social characteristics of individuals, they are socially distributed in ways that are far from random. Younger people and students are more likely to be e-mersives, but unlike the digital native thesis, for example, we find most young students falling into other cultural categories.

The group of young people that I’m interested in here falls especially into two of those cultures: The e-mersive and the cyber-savvy. Both of which might be worth looking at in more detail later. What I can see now, though, is that these two groups are the most likely to post original creative work on-line (rather than simply re-post what others have created. Interestingly, between the 2011 and 2013 surveys, the proportion of users putting creative stuff online has dipped a little, except for photographs. I guess that may be the Instagram effect. In fact the top five Social Network activities recorded in the survey are updating status; posting pictures; checking/changing privacy settings; clicking though to other websites; and leaving comments on someone else’s content.

Its an interesting report, but nothing novel comes out of it about young people’s use of the social networks. That should be reassuring I suppose, but it doesn’t particularly inform our front-end evaluation for a mobile game based around the Southampton Plot. So we’re going to have to ask young people themselves.

How to we ask, first of all, what sort of games they are playing? There are too many to list, so I’m toying with a “dummy” question that simplying gets respondents into the mood, by asking about a relatively random selection of games, but trying to include sandbox games like Minecraft, story games like Skyrim, MMORPGs like World of Warcraft, social games like Just Dance, etc. (And throwing in I Love Bees, as a wild card just to see if anybody bites at the Augmented reality game that seems to be closes to our very loose vision for the Southampton Plot. But the real meat is a free-text question that simply asks what is their favourite game that they’ve been playing recently.

My next thought has a bit more “science” behind it. Inspired by the simple typology put together by Nicole Lazzaro, I’ve taken seventeen statements her researched players used to illustrate the four types of fun she describes, and asked respondents to indicate how much they agree with them. My plan is to use some clever maths to identify what sort of mix of fun our potential gamers might enjoy.

Then I plan to ask them about the social networks they use, including the top three from the OIS data (Facebook, Instagram and Twitter) but also throwing Pintrest (which the US data also highlighted) and Foursquare (which I wanted to include because it is inherently locatative (though Facebook and Instagram are too, slightly more subtly). We’ll see how much our sample matches the published data in terms of users. I’ve also asked them to name another network if they are using that and its not one of my listed ones. Just in case MySpace is making its comeback at last 🙂 or G+ is finally getting traction.

Then I’ve suggested a similar question about messaging networks, like What’sApp and Snapchat.

I have also included a question about smartphones, whether they have one, one sort (iOS, Android etc) it is. And I’ve tried to create a question about how much of their social networking is mobile vs desk (or laptop) based, but it’s the one I’m least happy about.

Finally, as we’re trying to use this game to get people to places, I’ve asked about transport: walking; cycling; public transport; catching lifts; and being about to drive themselves. We’ll see how mobile they turn out to be.
 

Bodiam data again

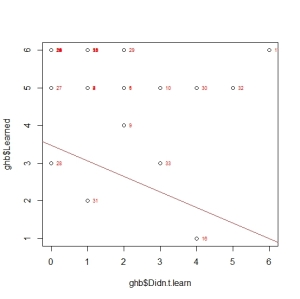
Yesterday, I said that I expected to see a strong negative correlation between “I didn’t learn very much new today” and “I learned about what Bodiam Castle was like in the past.” In fact, when I ran the correlation function in R, it came out at a rather miserly 0.33, much lower than I expected. So I asked R to draw me a scatterplot:

ScatterRegression(ghb$Didn.t.learn, ghb$Learned)

And there it is, some correlation, but not as much as I was expecting. (I added text labels to each datapoint, with row numbers on, as a quick and dirty way to see roughly where a single point represents more than one respondent.) I think this demonstrates two things. The first is that Likert scales can look awfully “categorical” when compared with true continuous numerical values. And the second is that I need a larger sample (if only to lessen the influence of outliers such as row 1, up the in the top right hand corner, which I fear maybe my own inputting error on the the first interview).

So rather than faff around with individual pairings, I created a correlation matrix of all the seven point Likert scale questions. Other than the learning questions I mentioned in my last post, I used the Likert agreement scale  for the following statements:

  • My sense of being in Bodiam Castle was stronger than my sense of being in the rest of the world
  • Bodiam Castle is an impressive sight
  • I was overwhelmed with the aesthetic/beauty aspect of Bodiam Castle
  • The visit had a real emotional impact on me
  • It was a great story
  • During my visit I remained aware of tasks and chores I have back at home/work
  • I enjoyed talking about Bodiam Castle with the others in my group
  • Bodiam Castle is beautiful
  • I wish I lived here when Bodiam Castle was at its prime, and
  • I enjoyed chatting with the staff and volunteers here

Looking through the results matrix, the strongest correlation that stands out (at 0.65) is between “It was a great story” and  “I learned about what Bodiam Castle was like in the past.” Which is nice. But remember, correlation ≠causation. Here, I wouldn’t even know where to start, did they admit to learning because the story was great? Or was the story great because they learned about it? And of course neither distribution can be called “normal.” The “correlation” is helped by the skew in both distributions of course.

Hist(ghb$learned$story1x2)ScatterRegression(ghb$Great.story, ghb$Learned)

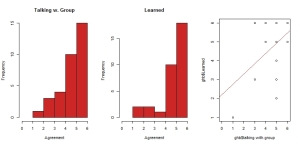
There’s also an interesting strong correlation(0.57)  between “I enjoyed talking about Bodiam Castle with the others in my group” and “I learned about what Bodiam Castle was like in the past.” Though I’m not suggesting cause and effect here, I’d like to follow up on this.

Histx2+Scatter(ghb$Talking.group$Learning)

Similarly, there are correlations between the responses which agreed that Bodiam had a great story, and those who enjoyed chatting within their group as well as with staff.

What about the lowest in the matrix? Rather scarily, there seems to be zero correlation between the “Didn’t learn anything new” statement and emotional impact. I’ve already told you about my caveats over emotional impact as something you can measure this way anyway, but zero correlation (when rounded to two decimal places)  sets alarm bells ringing about one of these arrays.

Histx2+Scatter(ghb$Did.nt.learn$Impact)

Anther correlation from the matrix is between “My sense of being in Bodiam Castle was stronger than my sense of being in the rest of the world” and “During my visit I remained aware of tasks and chores I have back at home/work”, which I guess could/should be expected. It does raise an interest question for the future though. If I had to chose just one of these statements to include in a future survey, which would it be? Based on these Histograms, I might chose the former, if only because it looks more “normal”:

Histx2(ghb$sense$home.work)

Its also interesting that, “Bodiam Castle is an impressive sight” correlates strongly with “Bodiam Castle is beautiful”(0.54) but less strongly with “I was overwhelmed with the aesthetic/beauty aspect of Bodiam Castle” (only 0.37). Those last two correlate strongly (0.55) with each other,  of course.

Histx3+Scatterx3(ghb$aesthetics)

The “I wish I lived here when Bodiam Castle was at its prime” and “What I learned on the visit challenged what I thought I knew about medieval life,” statements didn’t yield anything particularly interesting. I might drop them from the next survey. But what troubles me most, in an existential way, is the correlation between “I was overwhelmed with the aesthetic/beauty aspect of Bodiam Castle” and “The visit had a real emotional impact on me”.

ScatterRegression(ghb$aesthetic.beauty ~ ghb$Emotional.impact)

My whole career has been build around the idea that people want to know stuff, to learn things about places of significance. While its nice that aesthetics and emotions are closely bound, is there any space for the work I do?

A first look at my Bodiam data

Last week, I had a look at the developing script for the new Bodiam Castle interpretive experience (for want of a better word). It’s all looking very exciting. But what I should have been doing is what I’m doing now, running the responses from the on-site survey I did last year through R, to see what it tells me about the experience with out the new … thing, but also what it tells me about the questions I’m trying out.

A bit of a recap first. One thing we’ve learned from the regular visitor survey the the National Trust runs at most of its sites,  is that there is a correlation between “emotional impact” and now much visitors enjoy their visit. But what is emotional impact? And what drives it? In the Trust, we can see that some places consistently have more emotional impact than others. But those places that do well are so very different from each other, that its very hard to learn anything about emotional impact that is useful to those who score less well.

I was recently involved in a discussion with colleagues about whether we should even keep the emotional impact question in the survey, as I (and some others) think that now we know there’s a correlation, there doesn’t seem to be anything more we can learn by continuing to ask the question. Other disagree, saying the question’s presence in the survey reminds properties to think about how to increase their “emotional impact.”

So my little survey at Bodiam also includes the question, but I’m asking some other questions too to see if they might be more useful in measuring and helping us understand what drives the emotional impact.

First of all though, I as R to describe the data. I got 33 responses, though its appears that one or two people didn’t answer some of the questions. There are two questions that appear on the National Trust survey. The first (“Overall, how enjoyable was your visit to Bodiam Castle today?”)  gives categorical responses and according to R only three categories were ever selected. Checking out the data, I can see that the three responses selected are mostly “very enjoyable” with a  very few “enjoyable” and a couple “acceptable.” Which is nice for Bodiam, because nobody selected “disappointing” or “not enjoyable”, even though the second day was cold and rainy (there’s very little protection from the weather at Bodiam).

The second National Trust question was the one we were beating last week: “The visit had a real emotional impact on me.” Visitors are asked to indicate the strength of their agreement (or of course, disagreement) with the statement on a seven point Likert scale. Checking out the data in R, I can see everybody responded to this question, and the range of responses goes all the way from zero to six, with a median of 3 and mean of 3.33. There’s a relatively small negative skew to responses (-0.11), and kurtosis (peakyness) is -0.41. All of which suggests a seductively “normal” curve. Lets look at a histogram:

Hist(ghb$emotion)

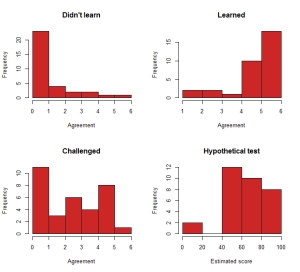
Looks familiar huh? I won’t correlate emotional impact with the “Enjoyable” question, you’ll have to take my word for it. Instead I’m keen to see what the answers to some of my other questions look like. I asked a few questions about learning, all different ways of asking the the same thing, to see how visitors’ responses compare (I’ll be looking for some strong correlation between these):

  • I didn’t learn very much new today
  • I learned about what Bodiam Castle was like in the past
  • What I learned on the visit challenged what I thought I knew about medieval life, and
  • If this were a test on the history of Bodiam, what do you think you you might score, out of 100?

The first three use the same 7 point Likert scale, and the last is a variable from 1 to 100. Lets go straight to some histograms:

Hist(ghb$learning2x2)

What do these tell us? Well, first of all a perfect demonstration of how Likert scale questions tend to “clumpiness” at one end or the other. The only vaguely “normal” one is the hypothetical test scores. The Didn’t Learn data looks opposite the Learned data, which given these questions are asking the opposite things, is what I expected. I’m sure I’ll see a strong negative correlation. What is more surprising is that so many people disagreed that they’d learned anything that challenged what they thought they knew about medieval life.

An educational psychologist might suggest that this shows that few few people had in fact, learned anything new. Or it might mean that I asked a badly worded question.

I wonder which?

We’ll have fun fun fun … (fun)

So, what I should be doing is analyzing the data I collected at Bodiam last year, but what I am actually doing is reading the some of the book that yesterdays’ discussion of the Bartle Test led me to. In particular I’ve been reading Nicole Lazzaro’s contribution to Beyond Game Design: Nine Steps Towards Creating Better Videogames, Understanding Emotions.

It got me on the first page, with a quote from the designer of some of my favourite games, Sid Meier: “Games are a series of interesting choices.” But Lazzaro expands on that truism and a way that I really like:

Games create engagement by how they shape attention and motivate action. To focus player attention, games simplify the world, enhance feedback, and suspend negative consequences – this maximises the effect of emotions coming from player choices. In the simplest terms, game mechanics engage the player by offering choices and providing feedback.

She goes on to separate User Experience (understanding how to play the game, manipulate thee controls etc) from Player Experience (having fun). Obviously the two go hand in hand, you can’t have fun if it isn’t easy to understand the controls, but by conflating the two designers might concentrate more on the “how to play” side and not enough on the emotional engagement. Emotions, she says, facilitate the player’s enjoyment; focus; decision-making; performance; and, learning. I wish I could think of a way to separate out visitor experience into two terms because I fear that cultural heritage interpretation can sometime focus on the the “how to visit” side (orientation, context setting etc) at the cost of making the visit emotionally engaging.

Then she discusses the challenge of measuring emotions, and draws on the work of Paul Ekman. She explains how his research identified just six emotions, which appear to have universal facial expressions (the expression of all the other emotions being culturally, and thus to a degree geographically specific): Anger; Fear; Surprise; Sadness; Happiness; and, Disgust. Handily, she says, these six emotions can frequently be recorded when watching players of video games. To those six, she adds another, which isn’t universal, but is relatively easily recognized, and again, very frequently seen on the faces of gamers: curiousity. I wonder how often, and in what circumstances, heritage sites provoke those seven emotions? Curiousity, I hope, is a given, but Anger? Fear? Disgust? (and I don’t just mean when faced with car parking or admission charges).

Of course she also mentions flow pointing out it is more of a state of being than an emotion. What’s really interesting though is that she observed “several aspects of player behaviour not predicted by Csikszentmihalyi’s model for flow.”

Truly absorbing gameplay requires more than a balance of difficulty and skill. Players leave games for other reasons than over-exertion or lack of challenge. In players’ favorite games. The degree of difficulty rises and falls, power-ups and bonuses make challenges more interesting, and the opportunity for strategy increases engagement. The progression of challenges to beat a boss monster and the drop of challenge at the start of the next level help keep players engaged.

Of course, one might argue that she’s taking Csikszentmihalyi balence of skill and difficulty too literally here. That anyone reading Csikszentmihalyi’s account of a rock-climber in flow, for example, will see similar fluctuations of challenge in the real world. But she does on:

Intense gameplay may produce frustration when the level of challenge is too high, but it can also produce different kids of emotions, such as curiosity or wonder. Futhermore, play can also emerge from decisions wholly unrelated to the game goal.

Additionally players spend a lot of time engaged in other activities, such as waving a Wiimote, wiggle their character or create a silly avatar, that require no difficulty to complete. Players respond to various things that characterize great gameplay for them, such as reward cycles, the feeling of winning, pacing, emotions from competition and cooperation.

She and her team at XEODesign researched the moments that players most enjoyed, and recorded the emotions that were expressed, and thus identified four distinct ways that people appear to play games, each of which was associated with a different set of emotions. This doesn’t mean there were four types of players, rather that people “seemed to rotate between three or four different types of choices in the games they enjoyed, and the best selling games tended to support at least three out of these four play styles… Likewise, blockbuster games containing the four play styles outsold competing similar titles that imitated only one kind of fun.”

What players liked the most about videogames can be summarized as follows:

  • The opportunity for challenge and mastery
  • The inspiration of imagination and fooling around
  • A ticket to relaxation and getting smarter (the means to change oneself)
  • An excuse to hang out with friends

Now surely cultural heritage sites offer at least three of those four?

Lazarro argues that “each play style is a collection of mechanics that unlocks a different set of player emotions.” And lists them thus:

Hard Fun

The emotion that the team observed here was fiero, an italian word borrowed by Eckman because decribes the personal feeling of triumph over adversity, an emotion for which there is no word in English. And the game mechanics that unlock that emotion (and possibly on the way, the emotions of frustration and boredom too) are: goals; challenge; obstacles; strategy; power ups; puzzles; score and points; bonuses; levels; and, monsters.

Easy Fun

Curiosity is the main emotion evident in the Easy Fun style of play, though surprise, wonder and awe were observed too. The game mechanics that define this style of play are: roleplay; exploration; experimentation; fooling around; having fun with the controls; iconic situations; ambiguity; detail; fantasy; uniqueness; “Easter Eggs”; tricks; story; and, novelty.

Serious Fun

What is the most common emotion observed with Serious Fun mechanics? Relaxation! The game mechanics that take players to that state are: rhythm; repetition; collection; completion; matching; stimulation; bright visuals; music; learning; simulation; working out; study; and real-world value. It’s this last mechanic that explains why its called “serious” fun. People playing in this mode also seem more ready to attach a value to their participation in the game outside the game itself – brain-training, physical exercise, developing skills or even a conscious effort to kill time (think of those people playing Candy Crush on the train).

People Fun

Happiness comes with People Fun, Lazzaro’s team observed “amusement, schadenfreude (pleasure in other people’s  misfortune) and naches (pleasure in the achievements of someone you have helped)” among players in this mode. Among the he long list of game mechanics that get people there are: cooperation; competition; communication; mentoring; leading; performing; characters; personalisation; open expression; jokes; secret meanings; nurturing; endorsements; chat; and gifting.


There’s a lot to think about here, but I’m excited by the possibilities. Here’s a challenge for cultural heritage interpretation. How many of these game mechanics are there already equivalents of in the visitor experience at heritage sites. And can we see value in creating equivalents for the mechanics that are missing?

The Bartle Test

I’ve been reading about the Bartle Test. It came up in conversation when somebody asked about player motivations. Turns out people have been asking similar questions for years, and after much discussion on the bulletin board of a UK “Multi-User Dungeon” Richard Bartle came up with a 1996 paper, outlining four gamer types.

A few years later, Erwin Andreasen and Brandon Downey came up with a web based test which players could take. So I took it.

Its a slow website, I gave up once, half way through, but eventually, discovered that I’m 93% Explorer, 73% Socialiser, 40% Acheiver, and 20% Killer.

I’m not at all convinced by the validity of the test. It’s a sort of disguised paired comparisons test, but unlike many I’ve taken, there were plenty of questions to which I wanted to reply “neither”. Also, in its current iteration least, the website comments with attempted humour as the participant selects their answer. I’d fear that this might influence some participants to change their answer before submitting their reply. But I can’t deny that I’m most like the “Explorer”.

Of course I don’t actually play MUDs (or the Massively Multiplayer Online Role Playing Games, with MUDs have evolved into) as I’m more of a table-top gamer. (I was going to say “old-school” but actually table top RPGs preceded MUDs but only a couple of years). So maybe it’s not surprising that I didn’t feel I could genuinely express a preference for either of the choices in some of the pairs. Maybe, as a player I don’t “suit” MUDs, as Bartle’s punning title to his paper implies. And the fact that I don’t play maybe the reason why I’m not entirely convinced by the four types Bartle suggested in the first place. Bartle pretty much invented MUDs after all, so I’ll bow to his experience.

(An aside: Dave Rickey’s discussion of game designers subverts Bartle’s model to give us “types” that I do recognise.)

In fact Bartle himself re-configured his four type taxonomy to one which featured eight types: Friend; Griefer; Hacker; Networker; Opportunist; Planner; Politician, and Scientist in his book Designing Virtual Worlds. By it’s the four-type taxonomy which seems to have stuck. I don’t know why the eight-type has less traction, perhaps it’s because, as Bartle himself apparently said, the four type model is easier to draw. I’m also surprised no-one has attempted to create a Bartle test for this new taxonomy, or indeed to challenge the model itself. The only couple I have found are this one from Jon Radoff, looking specifically at player motivations but for more games  than just MUDs, and this one from Nick Yee (his Daedalus Project does look like an interesting read).

Perhaps there are other models but, given the multimillion (billion?) dollar industry that computer based gaming has become, perhaps the developers prefer to keep their player motivation models to themselves.